Exhibit 3A-2 Comparison of Market Efficiency and Deadweight Loss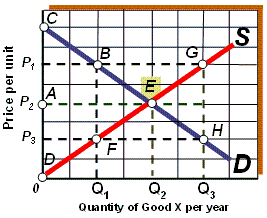
As shown in Exhibit 3A-2, if the quantity supplied of good X per year is Q1, the result is a deadweight loss represented by area:
A) BEG.
B) CBEFD.
C) EGH.
D) BEF.
Correct Answer:
Verified
Q60: Exhibit 3A-2 Comparison of Market Efficiency and
Q61: Exhibit 3A-1 Comparison of Market Efficiency and
Q62: Exhibit 3A-1 Comparison of Market Efficiency and
Q63: The slope of an indifference curve is
Q64: Along an indifference curve for goods X
Q66: An indifference map states:
A) indifference curves farther
Q67: Exhibit 3A-2 Comparison of Market Efficiency and
Q68: At the equilibrium price, deadweight loss is:
A)
Q69: If Max's marginal rate of substitution for
Q70: An indifference curve is:
A) downward sloping and
Unlock this Answer For Free Now!
View this answer and more for free by performing one of the following actions

Scan the QR code to install the App and get 2 free unlocks

Unlock quizzes for free by uploading documents