Exhibit 10A-1 Aggregate demand and supply model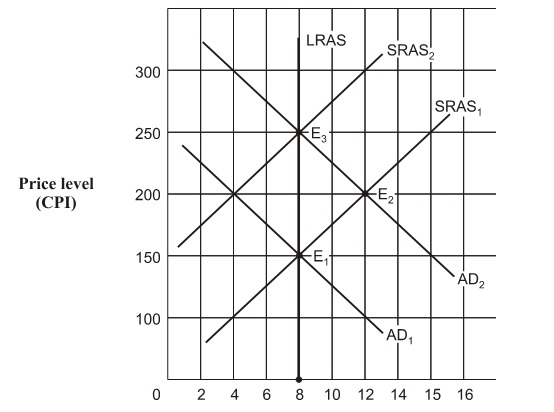
Beginning in Exhibit 10A-1 from long-run equilibrium at point E1, the aggregate demand curve shifts to AD2 . The economy's path to a new long-run equilibrium is represented by a movement from:
A) E 3 to E 1 to E 2 .
B) E 1 to E 3 to E 2 .
C) E 2 to E 1 to E 2 .
D) E 1 to E 2 to E 3 .
Correct Answer:
Verified
Q149: Economic growth is represented by a:
A) leftward
Q150: Q151: Exhibit 10A-5 Macro AD-AS Model Q152: A rightward shift in potential real GDP Unlock this Answer For Free Now! View this answer and more for free by performing one of the following actions Scan the QR code to install the App and get 2 free unlocks Unlock quizzes for free by uploading documents
Exhibit 10A-3 Macro AD-AS Model![]()
![]()


