In the three graphs below, which one is most likely to have a main effect for quarters (the variable that increases along the X axis) ?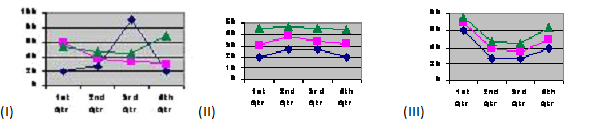
A) I
B) II
C) III
D) none.
Correct Answer:
Verified
Q19: To calculate the sum of squares for
Q20: Use the following ANOVA summary table to
Q21: In the factorial design analyses discussed in
Q22: To calculate the magnitude of effect estimates
Q23: Which of the following is NOT true
Q25: Which of the following graphs is most
Q26: To calculate the F for the interaction
Q27: If ω2 is calculated to yield the
Q28: A pediatrician is studying weight gain in
Q29: Unequal sample sizes in a factorial analysis
Unlock this Answer For Free Now!
View this answer and more for free by performing one of the following actions

Scan the QR code to install the App and get 2 free unlocks

Unlock quizzes for free by uploading documents