The capnogram seen in the figure shows which of the following?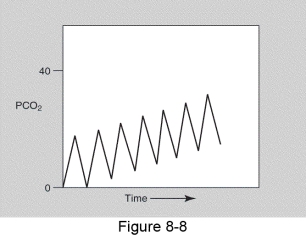
A) Chronic obstructive pulmonary disease
B) Cardiac oscillations
C) Rebreathing exhaled gases
D) Cheyne-Stokes breathing
Correct Answer:
Verified
Q104: In the below figure,C represents which of
Q105: What percent change in metabolic rate would
Q106: In the below figure,B represents which of
Q107: The arrow points to which of the
Q108: In the figure,the amount of pressure required
Q110: Which of the measurements shown in the
Q111: The device shown in the figure can
Q112: In the below figure,A is pointing to
Q113: The capnogram seen in the figure shows
Q114: Proteins contribute significantly to energy expenditure during
Unlock this Answer For Free Now!
View this answer and more for free by performing one of the following actions

Scan the QR code to install the App and get 2 free unlocks

Unlock quizzes for free by uploading documents