The figure given below depicts long-run equilibrium in the aggregate demand-aggregate supply model. Which of the following changes is depicted by the movement from Y1 to Y2?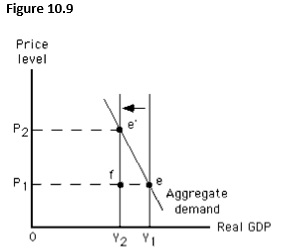
A) An increase in long-run aggregate supply
B) An increase in short-run aggregate supply
C) A decrease in short-run aggregate supply
D) A decrease in long-run aggregate supply
E) An increase in the aggregate quantity demanded
Correct Answer:
Verified
Q106: Which of the following changes best represents
Q121: The actual price level is assumed to
Q123: If resource prices are flexible,the long-run aggregate
Q125: Which of the following supply shocks would
Q126: An expansionary gap generally creates inflationary pressure
Q126: In the figure given below, when aggregate
Q127: At the potential level of output,there is
Q128: Actual output can exceed the economy's potential
Q132: Given a downward-sloping aggregate demand curve,if short-run
Q135: Stagflation is defined as:
A)decreased output accompanied by
Unlock this Answer For Free Now!
View this answer and more for free by performing one of the following actions

Scan the QR code to install the App and get 2 free unlocks

Unlock quizzes for free by uploading documents