The figure given below shows equilibrium in a money market. If S is the supply curve, the equilibrium interest rate and quantity of money will be: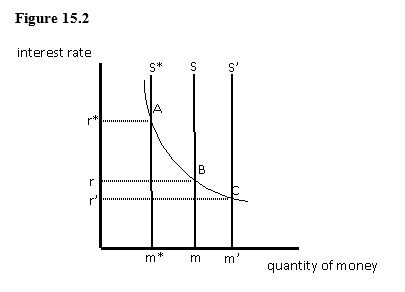
A) r and m, respectively.
B) r* and m*, respectively.
C) r' and m', respectively.
D) r and m', respectively.
E) r' and m*, respectively.
Correct Answer:
Verified
Q44: Which of these changes is likely to
Q45: In the aggregate demand-aggregate supply model in
Q46: Which of the following policies can be
Q50: If the Fed sells U.S.government securities in
Q50: The figure given below shows equilibrium in
Q51: The figure given below shows equilibrium in
Q53: The demand curve for investment depicts:
A)an inverse
Q53: The figure given below shows equilibrium in
Q58: All other things constant,when the interest rate
Q59: In the short run,a decrease in the
Unlock this Answer For Free Now!
View this answer and more for free by performing one of the following actions

Scan the QR code to install the App and get 2 free unlocks

Unlock quizzes for free by uploading documents