The figure given below shows short run and long run equilibrium in an aggregate demand-aggregate supply model. The economy shown in this figure is: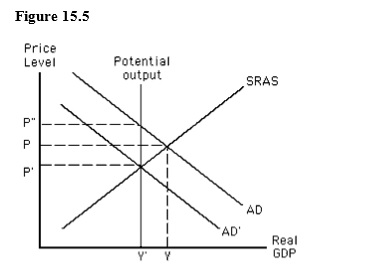
A) in a long-run equilibrium at the price level P and income level Y.
B) in a short-run equilibrium at the price level P and income level Y.
C) experiencing a contractionary gap at price level P and income level Y.
D) experiencing an expansionary gap at price level P" and income level Y'.
E) in a short-run equilibrium at the price level P' and income level Y.
Correct Answer:
Verified
Q81: According to the equation of exchange,if the
Q83: The velocity of money in circulation measures:
A)the
Q84: According to the equation of exchange,if nominal
Q85: The figure given below shows the aggregate
Q86: The figure given below shows the aggregate
Q86: If the money supply is $600,the price
Q89: If the money supply in an economy
Q91: According to the equation of exchange,if real
Q92: For a given increase in aggregate demand,the
Q94: Over the past 40 years,the most frequent
Unlock this Answer For Free Now!
View this answer and more for free by performing one of the following actions

Scan the QR code to install the App and get 2 free unlocks

Unlock quizzes for free by uploading documents