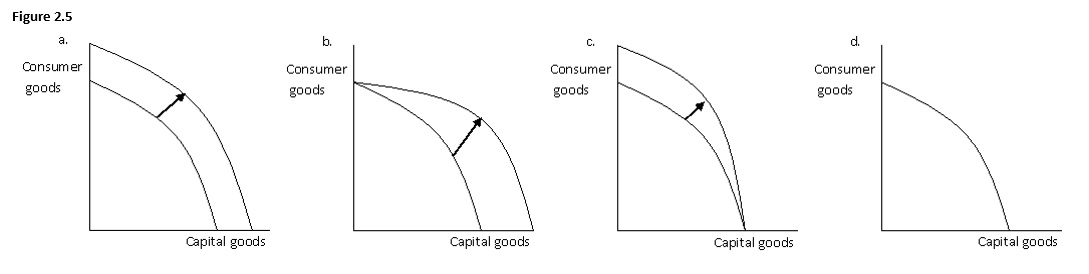
 The figure given below has four graphs showing the production possibilities frontier for capital goods and consumer goods. Which of the graphs below best illustrates the impact on the production possibilities frontier of a decrease in unemployment?
A) a.
B) b.
C) c.
D) d.
E) b and d.
Correct Answer:
Verified
Q90: Which of the following would shift the
Q107: Which of the following is not a
Q113: A production possibilities frontier can shift outward
Q117: An improvement in technology used to produce
Q143: An outward shift of the production possibilities
Q149: The production possibilities frontier will shift if
Q161: Every economy must answer each of the
Q165: Which economic question does the decision to
Q174: The set of mechanisms and institutions that
Q175: Adam Smith's term, "the invisible hand, "
Unlock this Answer For Free Now!
View this answer and more for free by performing one of the following actions

Scan the QR code to install the App and get 2 free unlocks

Unlock quizzes for free by uploading documents