Multiple Choice
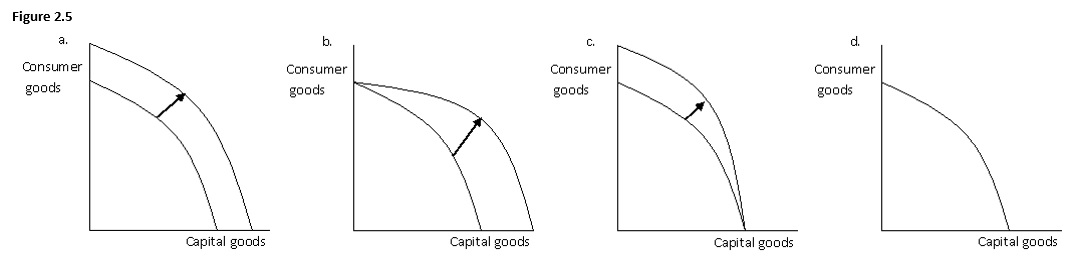 The following figure has four graphs showing the production possibilities frontier for capital goods and consumer goods. Which of the graphs below best illustrates the impact on the production possibilities frontier of a technological improvement that will make the resources used to produce consumer goods more efficient?
A) a.
B) b.
C) c.
D) d.
E) b and d.
Correct Answer:
Verified
Related Questions
Q104: Which economic question does the decision to
Q110: The reason that the production possibilities frontier

