The following table shows an aggregate demand schedule and an aggregate supply schedule. Which of the following is true? 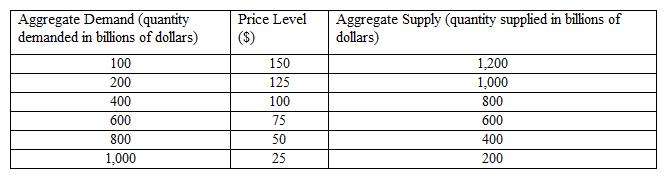
A) Equilibrium output is $1,000, and equilibrium price level is 25.
B) Equilibrium output is $800, and equilibrium price level is 50.
C) Equilibrium output is $200, and equilibrium price level is 125.
D) Equilibrium output is $400, and equilibrium price level is 25.
E) Equilibrium output is $600, and equilibrium price level is 75.
Correct Answer:
Verified
Q61: Identify the most likely impact of a
Q63: Which of the following is most likely
Q64: From 2009 to 2013,the price level in
Q66: Which of the following describes an economy's
Q71: Which of these is the most ideal
Q72: Which of these is a likely impact
Q73: _ varies along a given aggregate demand
Q74: Given an aggregate supply curve,a decrease in
Q75: In terms of the aggregate demand and
Q76: Economists use the price index to eliminate
Unlock this Answer For Free Now!
View this answer and more for free by performing one of the following actions

Scan the QR code to install the App and get 2 free unlocks

Unlock quizzes for free by uploading documents