The table below shows the price indexes and the nominal gross domestic product (GDP) for an economy from 2001 to 2005. The real GDP _____ between 2002 and 2003. 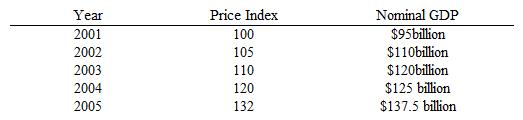
A) decreased by slightly more than $5 billion
B) increased by slightly more than $4 billion
C) remained constant
D) increased by only about $1 billion
E) decreased by $6 billion
Correct Answer:
Verified
Q90: If the nominal gross domestic product (GDP)for
Q102: If the real gross domestic product (GDP)for
Q103: If the real gross domestic product (GDP)for
Q104: A GDP price index of 100 for
Q105: A net increase in inventories is considered
Q110: The Consumer Price Index (CPI)is a measure
Q112: Real gross domestic product (GDP)is measured in
Q115: Real gross domestic product (GDP)shows:
A)total spending on
Q116: The table below shows the price indexes
Q118: Inventories help manufacturers cope with unexpected changes
Unlock this Answer For Free Now!
View this answer and more for free by performing one of the following actions

Scan the QR code to install the App and get 2 free unlocks

Unlock quizzes for free by uploading documents