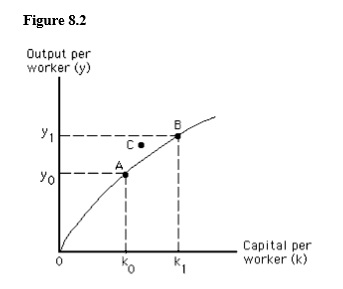
The figure below shows a per-worker production function. Point C in the figure below represents the level of output per worker that is unattainable with current technology.
Correct Answer:
Verified
Q121: The growing use of computers led to
Q123: An increase in the amount of capital
Q127: The diminishing slope of the per-worker production
Q130: Technological change leads to unemployment.
Q131: Technological change creates long-term hardships for workers
Q137: Education makes workers aware of the latest
Q139: Since 1870,U.S.labor productivity growth has averaged roughly
Q140: Between the 1880s and the early 21st
Q147: Basic research is conducted primarily by manufacturing
Q149: The share of research and development funding
Unlock this Answer For Free Now!
View this answer and more for free by performing one of the following actions

Scan the QR code to install the App and get 2 free unlocks

Unlock quizzes for free by uploading documents