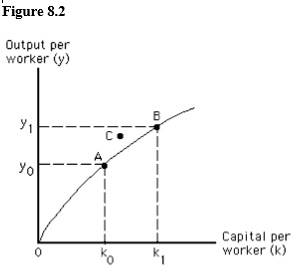
The figure below shows a per-worker production function. The shape of the per-worker production function illustrates the law of diminishing marginal returns to labor.
Correct Answer:
Verified
Q109: Productivity is measured as output per unit
Q113: The productivity of land is the most
Q122: Per capita GDP in the United States
Q125: Over the long run,technological change increases both
Q126: Improvements in technology shift the per-worker production
Q128: The process of adding more capital per
Q128: The figure below shows a per-worker production
Q129: Between 1982 and 2002,U.S.GDP per capita grew
Q136: The productivity growth slowdown of the late
Q138: The only way standard of living can
Unlock this Answer For Free Now!
View this answer and more for free by performing one of the following actions

Scan the QR code to install the App and get 2 free unlocks

Unlock quizzes for free by uploading documents