The table given below shows the disposable income and consumption of a household. In the table below, the level of saving at a disposable income of $1,200 is: 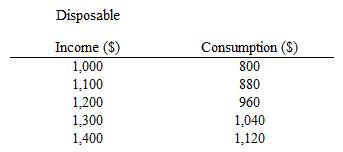
A) $80
B) $240
C) $950
D) $1,200
E) $1,300
Correct Answer:
Verified
Q1: If a household's income falls from $26,000
Q3: The difference between consumption spending and disposable
Q4: The sum of the marginal propensity to
Q6: If a household's income rises from $46,000
Q8: The marginal propensity to consume is:
A)the relationship
Q9: Historically,consumption spending in the United States has
Q13: Suppose an increase in disposable income from
Q16: Which of the following is true of
Q17: The fraction of an increase in income
Q18: If the marginal propensity to consume is
Unlock this Answer For Free Now!
View this answer and more for free by performing one of the following actions

Scan the QR code to install the App and get 2 free unlocks

Unlock quizzes for free by uploading documents