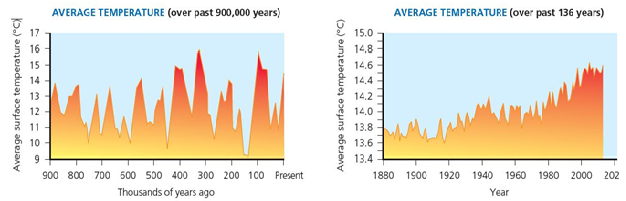
Solved

Figure 15.18 the Two Figures Presented Show Surface Temperatures Over Thousands of Over

Question 89

Essay

   Figure 15.18  The two figures presented show surface temperatures over thousands of years (left) and over the last 136 years (right). Why can you clearly see a gradual temperature increase in the figure on the right but see much more variable temperatures in the figure on the left?
Figure 15.18
The two figures presented show surface temperatures over thousands of years (left) and over the last 136 years (right). Why can you clearly see a gradual temperature increase in the figure on the right but see much more variable temperatures in the figure on the left?

Correct Answer:

verifed

Verified

The figure on the right shows recent inc...

View Answer

Unlock this answer now
Get Access to more Verified Answers free of charge

Related Questions

Unlock this Answer For Free Now!

View this answer and more for free by performing one of the following actions

qr-code

Scan the QR code to install the App and get 2 free unlocks

upload documents

Unlock quizzes for free by uploading documents