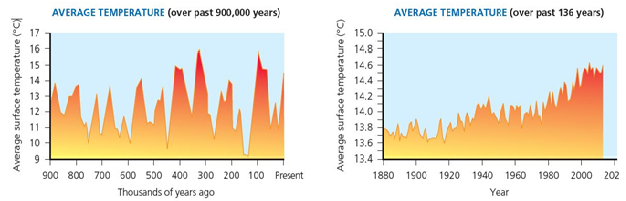
Figure 15.18
In the chart on the right in the accompanying figure, showing temperature for the past 900,000 years, describe the natural phenomena that may have caused the temperature fluctuations shown.
Correct Answer:
Verified
View Answer
Unlock this answer now
Get Access to more Verified Answers free of charge
Q79: In cities, urban _ worsen pollution because
Q80: _ is a colorless gas used in
Q81: Calculating your _ can help you understand
Q82: The increased use of _ automobiles could
Q83: If the climate change tipping point is
Q85: Q86: Q87: Explain the two basic approaches for dealing Q88: Most experts call for a combination of Q89: Unlock this Answer For Free Now! View this answer and more for free by performing one of the following actions Scan the QR code to install the App and get 2 free unlocks Unlock quizzes for free by uploading documents![]()
![]()
![]()

