Exhibit 2-19 Production possibilities curves 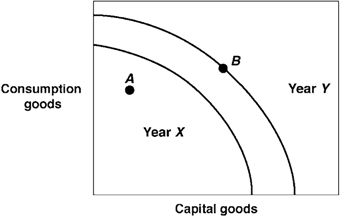 In Exhibit 2-19, the production possibilities curves for a country are shown for the years Year X and Year Y. Which of the following could have caused a shift for Year X to Year Y in production possibilities curves?
A) An increase in unemployment.
B) A decline in technology.
C) An increase in the stock of capital goods.
D) A natural disaster.
E) More efficient production.
Correct Answer:
Verified
Q143: Which of the following is true?
A) The
Q145: With time, which one of the following
Q147: A source of economic growth is:
A) unemployment.
B)
Q155: One source of economic growth is:
A) producing
Q166: The opportunity cost of producing a good
Q171: Exhibit 2-17 Production possibilities curve Q172: Exhibit 2-18 Production possibilities curves Q172: Which of the following statements is false? Q173: Exhibit 2-19 Production possibilities curves Q174: The process of accumulating capital is called: Unlock this Answer For Free Now! View this answer and more for free by performing one of the following actions Scan the QR code to install the App and get 2 free unlocks Unlock quizzes for free by uploading documents![]()
![]()
A)![]()
A)

