Exhibit 3-4 Supply curves 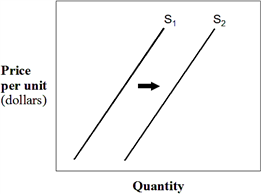 In Exhibit 3-4, a shift in the supply curve from S1 to S2 represents a(n) :
A) decrease in supply.
B) decrease in the quantity supplied.
C) increase in supply.
D) increase in the quantity supplied.
E) increase in demand.
Correct Answer:
Verified
Q125: Assuming that soybeans and tobacco can both
Q130: An improvement in a firm's technology that
Q134: A technological improvement in the production of
Q137: "Because of unseasonable cold weather, much of
Q138: A shift occurs in the supply curve
Q203: There is a technological advance in the
Q208: Seller A, has an upward-sloping supply curve,
Q214: A change in supply cannot be caused
Q224: Which of the following will increase the
Q225: Assuming that wheat and corn can both
Unlock this Answer For Free Now!
View this answer and more for free by performing one of the following actions

Scan the QR code to install the App and get 2 free unlocks

Unlock quizzes for free by uploading documents