Exhibit 3-10 Demand and supply curves 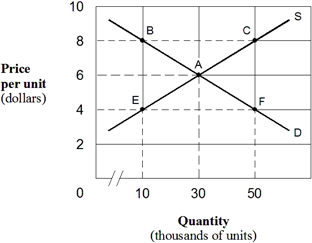 In Exhibit 3-10, which of the following is true about this graph?
A) When the price is $4, there is an excess supply.
B) When the price is $8, there is an excess demand.
C) When the price is $4, excess supply is greater than excess demand.
D) When the price is $8, excess demand is greater than excess supply.
E) When the price is $6, there is no excess demand or excess supply.
Correct Answer:
Verified
Q281: Exhibit 3-11 Demand and supply curves 
Q282: Exhibit 3-8 Demand and supply data for radios
Q283: Exhibit 3-7 Demand and supply curves
Q284: Exhibit 3-8 Demand and supply data for radios
Q285: Exhibit 3-8 Demand and supply data for radios
Q287: Exhibit 3-8 Demand and supply data for radios
Q288: Exhibit 3-10 Demand and supply curves
Q289: Exhibit 3-8 Demand and supply data for radios
Q290: Exhibit 3-12 Supply and demand data
Q291: Exhibit 3-9 Demand and supply curves
Unlock this Answer For Free Now!
View this answer and more for free by performing one of the following actions

Scan the QR code to install the App and get 2 free unlocks

Unlock quizzes for free by uploading documents