Exhibit 3-11 Demand and supply curves 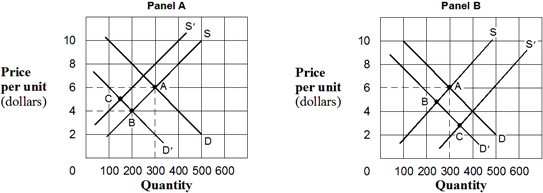 In Exhibit 3-11, in Panel A the movement from A to B describes a(n) :
A) increase in demand and an increase in the quantity supplied.
B) increase in the quantity demanded and an increase in supply.
C) decrease in demand and a decrease in the quantity supplied.
D) decrease in the quantity demanded and a decrease in supply.
E) decrease in the quantity demanded and an increase in supply.
Correct Answer:
Verified
Q249: In a market, competitive forces guarantee that
Q250: If the current price of a good
Q263: When the price of a good
Q268: At any price below the equilibrium
Q278: If the price of tea is below
Q282: Exhibit 3-8 Demand and supply data for radios
Q283: Exhibit 3-7 Demand and supply curves 
Q284: Exhibit 3-8 Demand and supply data for radios
Q285: Exhibit 3-8 Demand and supply data for radios
Q286: Exhibit 3-10 Demand and supply curves
Unlock this Answer For Free Now!
View this answer and more for free by performing one of the following actions

Scan the QR code to install the App and get 2 free unlocks

Unlock quizzes for free by uploading documents