Exhibit 3-11 Demand and supply curves 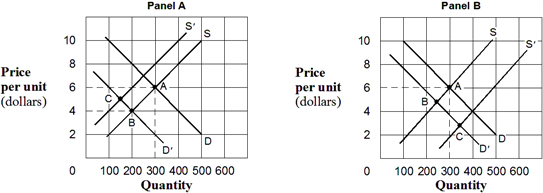 In Exhibit 3-11, in Panel A the movement from A to C describes a(n) :
A) ambiguous change in price and a decrease in quantity.
B) increase in price and an ambiguous change in quantity.
C) increase in both price and quantity.
D) decrease in both price and quantity.
E) change in supply that dominates a change in demand.
Correct Answer:
Verified
Q293: Exhibit 3-6 Milk market Q294: Exhibit 3-7 Demand and supply curves Q295: Exhibit 3-9 Demand and supply curves Q296: Exhibit 3-8 Demand and supply data for radios Q297: Exhibit 3-11 Demand and supply curves Q299: Exhibit 3-12 Supply and demand data Q300: Exhibit 3-10 Demand and supply curves Q301: Exhibit 3-15 Supply and demand curves for good Q302: Exhibit 3-16 Supply and demand curves for chairs Q303: Exhibit 3-16 Supply and demand curves for chairs![]()

Unlock this Answer For Free Now!
View this answer and more for free by performing one of the following actions

Scan the QR code to install the App and get 2 free unlocks

Unlock quizzes for free by uploading documents