Exhibit 3-12 Supply and demand data 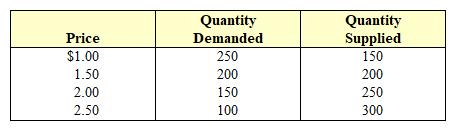 In Exhibit 3-12 the equilibrium price and quantity in the market are:
A) $1.00, 200.
B) $1.50, 400.
C) $2.00, 100.
D) $1.50, 200.
Correct Answer:
Verified
Q305: Exhibit 3-14 Supply and demand curves 
Q306: Exhibit 3-16 Supply and demand curves for chairs
Q307: Exhibit 3-15 Supply and demand curves for good
Q307: Demand curves slope downward to the right.
Q308: Exhibit 3-14 Supply and demand curves
Q310: Exhibit 3-13 Supply and demand curves
Q311: Exhibit 3-13 Supply and demand curves
Q311: Other things being equal, an increase in
Q312: Other things being equal, a fall in
Q313: Exhibit 3-15 Supply and demand curves for good
Unlock this Answer For Free Now!
View this answer and more for free by performing one of the following actions

Scan the QR code to install the App and get 2 free unlocks

Unlock quizzes for free by uploading documents