Exhibit 4-3 Supply and demand curves 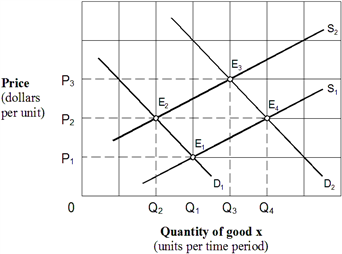 Initially the market shown in Exhibit 4-3 is in equilibrium at P2, Q2 (E2) . Changes in market conditions result in a new equilibrium at P2, Q4 (E4) . This change is stated as a(n) :
A) increase in supply and an increase in demand.
B) increase in supply and a decrease in demand.
C) decrease in demand and a decrease in supply.
D) increase in demand with supply held constant at S2.
Correct Answer:
Verified
Q25: Exhibit 4-2 Supply and demand curves 
Q25: A hurricane destroyed the peach crop in
Q27: Exhibit 4-1 Supply and demand data
Q28: Exhibit 4-2 Supply and demand curves
Q30: Exhibit 4-2 Supply and demand curves
Q31: If Congress decides to increase the tax
Q38: An increase in the price of plastic
Q39: A decrease in consumer income decreases the
Q175: Consider the market for grapes. An increase
Q180: If you were a government official that
Unlock this Answer For Free Now!
View this answer and more for free by performing one of the following actions

Scan the QR code to install the App and get 2 free unlocks

Unlock quizzes for free by uploading documents