Exhibit 4-3 Supply and demand curves 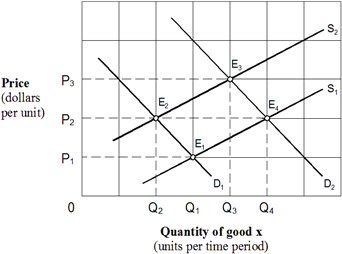 Initially the market shown in Exhibit 4-3 is in equilibrium at P3, Q3 (E3) . Changes in market conditions result in a new equilibrium at P2, Q2 (E2) . This change is stated as a(n) :
A) decrease in demand and an increase in supply.
B) decrease in demand and a decrease in quantity supplied.
C) decrease in quantity demanded and an increase in quantity supplied.
D) decrease in quantity demanded and an increase in supply.
Correct Answer:
Verified
Q29: Which of the following would raise both
Q49: Exhibit 4-3 Supply and demand curves 
Q50: Exhibit 4-4 Supply and demand curves for good
Q52: Exhibit 4-5 Supply and demand curves for computers
Q53: Exhibit 4-4 Supply and demand curves for good
Q55: Exhibit 4-4 Supply and demand curves for good
Q55: If the cost of fertilizer rises, then
Q56: Exhibit 4-4 Supply and demand curves for good
Q58: Exhibit 4-3 Supply and demand curves
Q59: Exhibit 4-3 Supply and demand curves
Unlock this Answer For Free Now!
View this answer and more for free by performing one of the following actions

Scan the QR code to install the App and get 2 free unlocks

Unlock quizzes for free by uploading documents