Exhibit 5-3 Demand curves for gallons of orange juice 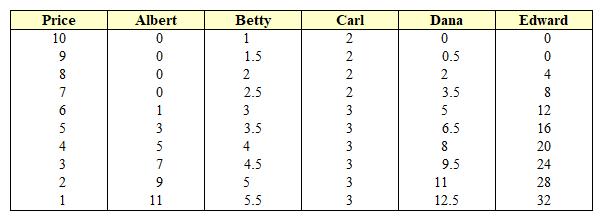 Using Exhibit 5-3, whose "quantity demanded" experiences the largest percentage increase when the price falls from $2 to $1?
A) Albert
B) Betty
C) Carl
D) Dana
E) Edward
Correct Answer:
Verified
Q65: If a supplier faces a perfectly horizontal
Q72: Which of the following describes a situation
Q80: Which of the following statements is true
Q84: If Stimpson University increases tuition in order
Q90: Exhibit 5-3 Demand curves for gallons of orange
Q91: If an increase in the price of
Q98: If a revenue-maximizing firm is told that
Q99: If the value of the price elasticity
Q100: If an increase in the price of
Q106: Which of the following describes a situation
Unlock this Answer For Free Now!
View this answer and more for free by performing one of the following actions

Scan the QR code to install the App and get 2 free unlocks

Unlock quizzes for free by uploading documents