Exhibit 5-8 Supply and demand curves for good X 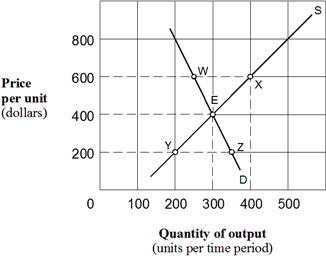 As shown in Exhibit 5-8, the price elasticity of demand for good X between points E and Z is:
A) 3/13 = 0.23.
B) 13/3 = 4.33.
C) 1/3 = 0.33.
D) 1.
Correct Answer:
Verified
Q64: Other things constant, the price elasticity of
Q84: The price elasticity of demand coefficient for
Q84: The price elasticity of demand coefficient for
Q124: In the short run, consumers typically _
Q131: Which of the following factors is associated
Q138: Which of the following statements is true
Q141: Exhibit 5-9 Supply and demand curves for good
Q147: In the long run, price elasticities of
Q148: Exhibit 5-9 Supply and demand curves for good
Q243: The price elasticity of demand measures consumer
Unlock this Answer For Free Now!
View this answer and more for free by performing one of the following actions

Scan the QR code to install the App and get 2 free unlocks

Unlock quizzes for free by uploading documents