Exhibit 6-13 Cost curves 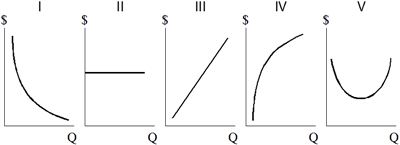 In Exhibit 13, TFC is shown by the graph labeled:
A) I.
B) II.
C) III.
D) IV.
E) V.
Correct Answer:
Verified
Q86: Which of the following is true at
Q101: Diseconomies of scale exist over the range
Q106: Since the 1980s, Wal-Mart stores have appeared
Q165: If the minimum points of all the
Q175: Exhibit 6-12 Cost schedule for producing pizza
Q176: Exhibit 6-12 Cost schedule for producing pizza
Q176: For a typical firm, the long-run average
Q178: Exhibit 6-12 Cost schedule for producing pizza
Q180: Exhibit 6-11 Short-run cost curves schedule for pizzeria's
Q193: Economies of scale imply that within some
Unlock this Answer For Free Now!
View this answer and more for free by performing one of the following actions

Scan the QR code to install the App and get 2 free unlocks

Unlock quizzes for free by uploading documents