Exhibit 6-14 Cost curves 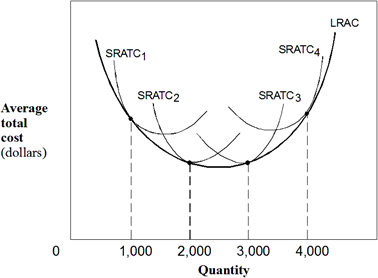 In Exhibit 6-14, the U-shaped LRAC curve indicates which of the following as quantity increases from 0 to 4,000?
A) Diseconomies of scale; constant returns to scale; economies of scale.
B) Constant returns to scale; economies of scale; diseconomies of scale.
C) Economies of scale; constant returns to scale; diseconomies of scale.
D) Diseconomies of scale; economies of scale; constant returns to scale.
E) Economies of scale; diseconomies of scale; constant returns to scale.
Correct Answer:
Verified
Q115: Constant returns to scale cause the long-run
Q202: Exhibit 6-16 Long-run average cost curves 
Q203: Exhibit 6-15 Long-run average cost Q204: Exhibit 6-17 Long-run average cost curve Q205: Exhibit 6-15 Long-run average cost Q206: Exhibit 6-16 Long-run average cost curves Q208: Constant returns to scale exist over the Q209: Exhibit 6-17 Long-run average cost curve Q211: Exhibit 6-14 Cost curves Q212: Exhibit 6-15 Long-run average cost Unlock this Answer For Free Now! View this answer and more for free by performing one of the following actions Scan the QR code to install the App and get 2 free unlocks Unlock quizzes for free by uploading documents![]()
![]()
![]()
![]()

