Exhibit 7-2 Total revenue and total cost graph 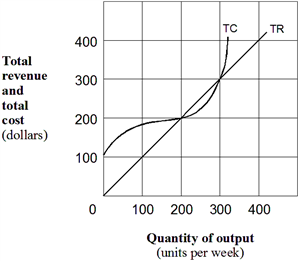 At an output of 250 units, as shown in Exhibit 7-2, marginal cost is:
A) greater than marginal revenue.
B) equal to marginal revenue.
C) less than marginal revenue.
D) none of the above.
Correct Answer:
Verified
Q89: Above the shutdown point, a competitive firm's
Q92: When the price of a good is
Q115: Exhibit 7-3 Cost per unit curves 
Q116: A perfectly competitive firm's short-run supply curve
Q117: Exhibit 7-2 Total revenue and total cost graph
Q118: Exhibit 7-3 Cost per unit curves
Q121: Exhibit 7-8 A firm's cost and marginal revenue
Q122: Exhibit 7-5 A firm's MR and MC curves
Q123: Exhibit 7-5 A firm's MR and MC curves
Q124: Exhibit 7-7 A firm's cost and MR curves
Unlock this Answer For Free Now!
View this answer and more for free by performing one of the following actions

Scan the QR code to install the App and get 2 free unlocks

Unlock quizzes for free by uploading documents