Exhibit 2-15 Production possibilities curve 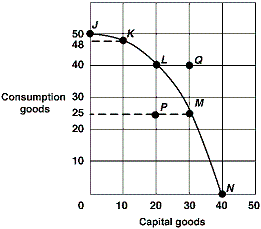
In Exhibit 2-15, if the economy moves from point L to point M, the opportunity cost of producing 10 more capital goods is:
A) 40 fewer consumption goods because at point L, 20 capital goods and 40 consumption goods are produced.
B) 25 fewer consumption goods because at point M 30 capital goods and 25 consumption goods are produced.
C) 15 fewer consumption goods because to go from 20 capital goods to 30 capital goods, the economy must go from 40 consumption goods to 25 consumption goods.
D) 15 more consumption goods because to go from 30 capital goods to 20 capital goods, the economy must go from 25 consumption goods to 40 consumption goods.
Correct Answer:
Verified
Q21: The amount of a good that must
Q25: A farmer is deciding whether or not
Q30: Exhibit 2-2 Production possibilities curve 
Q32: Exhibit 2-1 Production possibilities curve data
Q35: When deciding whether to buy a second
Q35: Exhibit 2-2 Production possibilities curve
Q36: While waiting in line to buy two
Q39: According to marginal analysis, you should choose
Q39: Exhibit 2-1 Production possibilities curve data
Q40: Why are all costs really "opportunity costs"?
Unlock this Answer For Free Now!
View this answer and more for free by performing one of the following actions

Scan the QR code to install the App and get 2 free unlocks

Unlock quizzes for free by uploading documents