Exhibit 2-2 Production possibilities curve 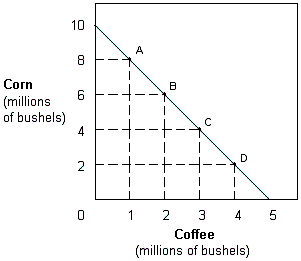
In Exhibit 2-2, the slope of the production possibilities curve indicates that the opportunity cost of:
A) coffee is constant.
B) coffee is increasing.
C) coffee is decreasing.
D) corn is increasing.
Correct Answer:
Verified
Q62: The law of increasing opportunity costs causes
Q63: Exhibit 2-15 Production possibilities curve 
Q64: Exhibit 2-8 Production possibilities curve data
Q65: Exhibit 2-12 Production possibilities curve
Q69: Exhibit 2-16 Production possibilities curve
Q70: Exhibit 2-10 Production possibilities curve data
Q72: Exhibit 2-13 Production possibilities curve
Q73: Draw a graph of a production possibilities
Q79: As production of a good increases, opportunity
Q80: When the opportunity cost of producing carrots
Unlock this Answer For Free Now!
View this answer and more for free by performing one of the following actions

Scan the QR code to install the App and get 2 free unlocks

Unlock quizzes for free by uploading documents