Exhibit 4-2 Supply and demand curves 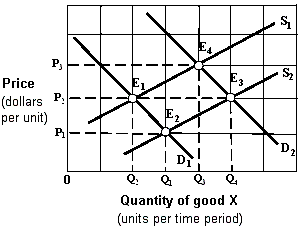
The market shown in Exhibit 4-2 is initially in equilibrium at E3. Changes in market conditions result in a new equilibrium at E4. This change is stated as a(n) :
A) increase in demand and an increase in supply.
B) decrease in demand and a decrease in quantity supplied.
C) increase in supply and an increase in quantity demanded.
D) decrease in supply and a decrease in quantity demanded.
Correct Answer:
Verified
Q1: Exhibit 4-1 Supply and demand data
Q7: Exhibit 4-2 Supply and demand curves
Q8: Exhibit 4-2 Supply and demand curves
Q9: If we observe a decrease in the
Q9: Exhibit 4-2 Supply and demand curves
Q11: Exhibit 4-2 Supply and demand curves
Q12: If we observe a decrease in the
Q161: If the demand for a good decreased,
Q170: Which of the following is the most
Q239: If there is a decrease in demand
Unlock this Answer For Free Now!
View this answer and more for free by performing one of the following actions

Scan the QR code to install the App and get 2 free unlocks

Unlock quizzes for free by uploading documents