Exhibit 4-3 Supply and demand curves 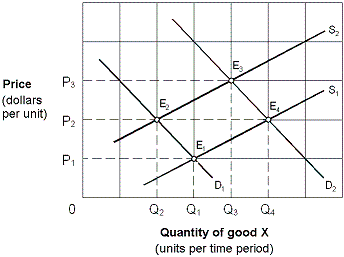
Initially the market shown in Exhibit 4-3 is in equilibrium at P3, Q3 (E3) . Changes in market conditions result in a new equilibrium at P2, Q2 (E2) . This change is stated as a:
A) decrease in demand and an increase in supply.
B) decrease in demand and a decrease in quantity supplied.
C) decrease in quantity demanded and an increase in quantity supplied.
D) decrease in quantity demanded and an increase in supply.
Correct Answer:
Verified
Q26: Suppose the market for "soda X" is
Q36: Exhibit 4-7 Demand and supply schedules
Q37: Exhibit 4-6 Demand and supply curves
Q38: Exhibit 4-5 Supply and demand curves for
Q39: Exhibit 4-3 Supply and demand curves
Q41: Exhibit 4-11 Data on supply and
Q42: Stuart tells his student government representative at
Q46: An increase in both supply and demand
Q49: An increase in demand and a decrease
Q57: If the equilibrium price of good X
Unlock this Answer For Free Now!
View this answer and more for free by performing one of the following actions

Scan the QR code to install the App and get 2 free unlocks

Unlock quizzes for free by uploading documents