Exhibit 4-8 Demand and supply curves 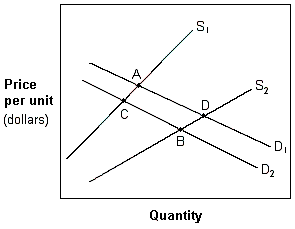
In Exhibit 4-8, a movement from A to B in which price has decreased and quantity has increased is best explained by a(n) :
A) increase in supply and demand.
B) decrease in supply and demand.
C) increase in supply that dominates a decrease in demand.
D) increase in demand that dominates a decrease supply.
Correct Answer:
Verified
Q44: If the equilibrium price of aspirin is
Q47: Exhibit 4-8 Demand and supply curves
Q47: Rent control applies to about two-thirds of
Q48: Exhibit 4-8 Demand and supply curves
Q50: When the government imposes an $8 price
Q52: Ceteris paribus , an increase in the
Q53: If the government imposes a price ceiling
Q55: Price ceilings set below the equilibrium create:
A)
Q60: If the equilibrium price of natural gas
Q232: If a government imposed price ceiling legally
Unlock this Answer For Free Now!
View this answer and more for free by performing one of the following actions

Scan the QR code to install the App and get 2 free unlocks

Unlock quizzes for free by uploading documents