Exhibit 5-9 Supply and Demand Curves for Good X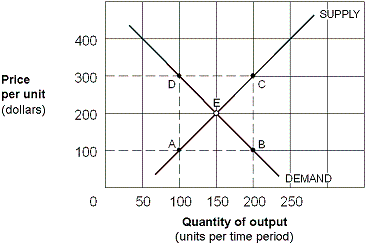
As shown in Exhibit 5-9, the price elasticity of demand for good X between points E and B is:
A) 3/7 = 0.43.
B) 7/3 = 2.33.
C) 1/2 = 0.50.
D) 1.
Correct Answer:
Verified
Q19: If the percentage change in the quantity
Q30: Which statement about price elasticity of demand
Q40: Since it is always a negative number,
Q41: As one moves down a straight-line, down-sloping
Q46: If a 5 percent decrease in the
Q49: Exhibit 5-4 Demand curves for silver
Q51: Consider the market for bicycles. If a
Q53: If a good has a price elasticity
Q55: If an increase in the price of
Q58: If a straight-line demand curve slopes down,
Unlock this Answer For Free Now!
View this answer and more for free by performing one of the following actions

Scan the QR code to install the App and get 2 free unlocks

Unlock quizzes for free by uploading documents