Exhibit 5-9 Supply and Demand Curves for Good X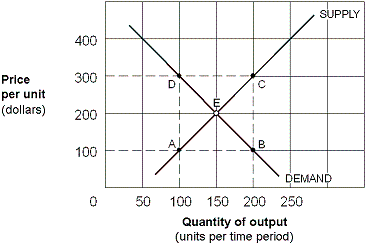
As shown in Exhibit 5-9, the $200 per unit tax on Good X raises tax revenue per time period totaling:
A) $10,000.
B) $20,000.
C) $30,000.
D) $60,000.
Correct Answer:
Verified
Q85: A lower price elasticity of demand coefficient
Q94: If the short-run price elasticity of demand
Q96: For which of the following goods are
Q107: Exhibit 5-9 Supply and Demand Curves for
Q129: Using supply and demand analysis, which of
Q144: If an excise tax is placed on
Q145: To raise the most tax revenue, governments
Q146: Good A has a price elasticity of
Q148: If a government tax has as its
Q150: In the country of Bora Bora, consumers
Unlock this Answer For Free Now!
View this answer and more for free by performing one of the following actions

Scan the QR code to install the App and get 2 free unlocks

Unlock quizzes for free by uploading documents