Multiple Choice
Exhibit 6-13 Cost curves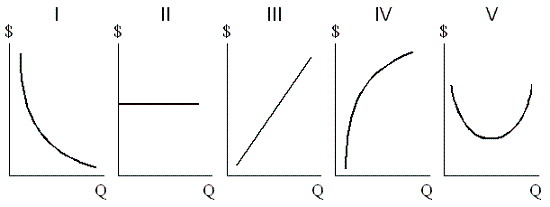
In Exhibit 6-13, ATC is shown by the graph labeled:
A) I.
B) II.
C) III.
D) V.
Correct Answer:
Verified
Related Questions
Q48: A downward-sloping portion of a long-run average
Q88: Both the marginal cost and the average
Q91: Exhibit 6-11 Short-run cost schedule for
Q94: If the marginal cost of the 100th
Unlock this Answer For Free Now!
View this answer and more for free by performing one of the following actions

Scan the QR code to install the App and get 2 free unlocks

Unlock quizzes for free by uploading documents