Exhibit 6 -14 Cost curves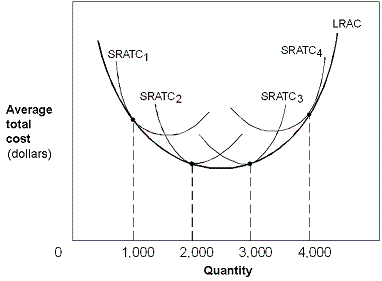
In Exhibit 6-14, the U-shaped LRAC curve indicates which of the following as quantity increases from 0 to 4,000?
A) Diseconomies of scale; constant returns to scale; economies of scale.
B) Constant returns to scale; economies of scale; diseconomies of scale.
C) Economies of scale; constant returns to scale; diseconomies of scale.
D) Economies of scale; diseconomies of scale; constant returns to scale.
Correct Answer:
Verified
Q101: Diseconomies of scale exist over the range
Q104: Economies of scale can be caused by
Q105: A car leasing company that expands its
Q108: The decreasing portion of a firm's long
Q116: If the long-run average cost of producing
Q118: Exhibit 6 -14 Cost curves Q120: If a firm enlarges its factory size Q120: Exhibit 6-15 Long-run average cost Q121: Exhibit 6-15 Long-run average cost Q122: Exhibit 6-16 Long-run average cost curves Unlock this Answer For Free Now! View this answer and more for free by performing one of the following actions Scan the QR code to install the App and get 2 free unlocks Unlock quizzes for free by uploading documents![]()
![]()
![]()


