Exhibit 7-2 Total revenue and total cost graph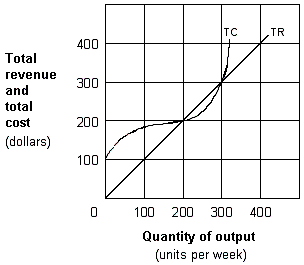
In Exhibit 7-2, economic profit for the firm is at a maximum when output per week equals:
A) 100 units.
B) 200 units.
C) 250 units.
D) 300 units.
Correct Answer:
Verified
Q42: Consider a firm with the following cost
Q47: Suppose a company increases production from a
Q49: Exhibit 7-3 Cost per unit curves
Q49: If a perfectly competitive firm sells 50
Q51: The market price for wallets is $20.
Q52: Exhibit 7-5 A firm's MR and MC
Q53: If a fishing boat owner brings 10,000
Q53: Exhibit 7-4 Marginal cost and revenue
Q54: The neighborhood ice cream shop finds that
Q55: A portrait photographer produces output in packages
Unlock this Answer For Free Now!
View this answer and more for free by performing one of the following actions

Scan the QR code to install the App and get 2 free unlocks

Unlock quizzes for free by uploading documents