The plot shown below represents a correlation of 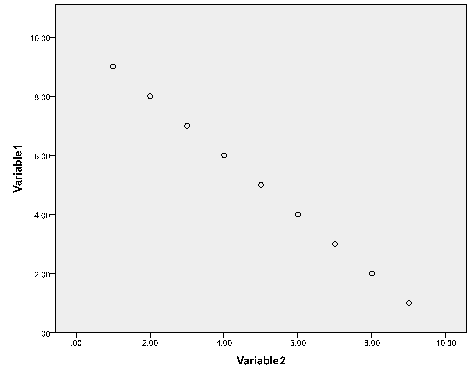
A) +1.00.
B) +0.80.
C) -0.80.
D) -1.00.
Correct Answer:
Verified
Q9: A counselor observed a strong tendency for
Q10: A researcher wants to find out whether
Q11: Experts find a strong relationship between reading
Q12: When choosing a curriculum or intervention program,
Q13: In Urie Bronfenbrenner's bioecological model, processes that
Q15: A researcher wants to know whether successful
Q16: A test that measures what it claims
Q17: The plot shown below most likely represents
Q18: If you want to investigate how a
Q19: By the time a well-designed longitudinal study
Unlock this Answer For Free Now!
View this answer and more for free by performing one of the following actions

Scan the QR code to install the App and get 2 free unlocks

Unlock quizzes for free by uploading documents