Multiple Choice
Figure 2-2 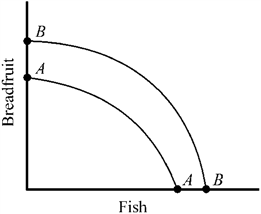 Which of the following would most likely cause the production possibilities curve for breadfruit and fish to shift outward from AA to BB in Figure 2-2?
A) a decrease in the labor force of the country
B) a sudden change in consumer preferences for more fish and less breadfruit
C) a major technological advance
D) a decrease in the capital stock
Correct Answer:
Verified
Related Questions

