Figure 4-5 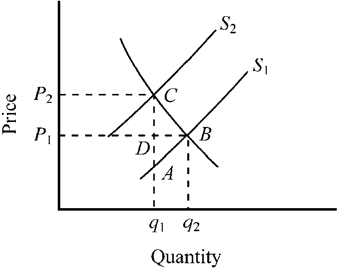 Figure 4-5 represents the market for gasoline before and after a per-gallon tax. What does the triangular area ABC represent?
A) the amount of revenue raised due to imposing the tax
B) the loss in consumer surplus due to imposing the tax
C) the loss in producer surplus due to imposing the tax
D) the deadweight loss (or excess burden) caused by the tax
Correct Answer:
Verified
Q9: If there was an increase in the
Q14: Rent control applies to about two-thirds of
Q18: Other things constant, a decrease in the
Q161: Use the figure below to answer the
Q165: Use the figure below to answer the
Unlock this Answer For Free Now!
View this answer and more for free by performing one of the following actions

Scan the QR code to install the App and get 2 free unlocks

Unlock quizzes for free by uploading documents