Use the figure below to answer the following question(s) . Figure 4-9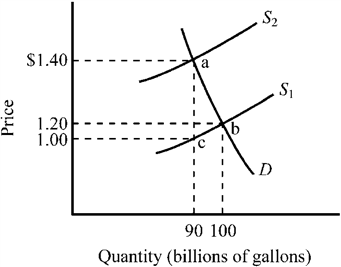 Refer to Figure 4-9. The market for gasoline was initially in equilibrium at point b. If a $.40 excise tax was imposed,
A) the supply of gasoline would shift to S2.
B) the price of gasoline to consumers would increase from $1.20 per gallon to $1.40 per gallon.
C) the net price received by producers of gasoline would decline from $1.20 per gallon to $1.00 per gallon.
D) all of the above would occur.
Correct Answer:
Verified
Q1: If the demand for a good is
Q15: Which of the following is the most
Q20: The Laffer curve illustrates the concept that
A)
Q179: Use the figure below illustrating the impact
Q181: Use the figure below illustrating the impact
Q183: Use the figure below to answer the
Q184: Use the figure below to answer the
Q185: Use the figure below to answer the
Q186: Use the figure below to answer the
Q187: Use the figure below to answer the
Unlock this Answer For Free Now!
View this answer and more for free by performing one of the following actions

Scan the QR code to install the App and get 2 free unlocks

Unlock quizzes for free by uploading documents