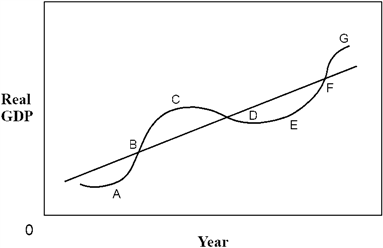
Figure 8-1  In Figure 8-1, point E represents:
A) recession and a trough.
B) peak and a trough.
C) recession and a peak.
D) recovery and a peak.
Correct Answer:
Verified
Q155: The employment/population ratio _ between 1980 and
Q156: During the last several decades the labor
Q157: Teenage unemployment is substantially higher than unemployment
Q158: Which of the following best explains why
Q159: As the economy recovered from the 2008-2009
Q161: Evaluate the economic validity of the following
Q162: Suppose that the consumer price index at
Q163: Suppose there was a country with an
Q164: Answer the following questions:
a.What is meant by
Q165: Economists use the term "business cycle" to
Unlock this Answer For Free Now!
View this answer and more for free by performing one of the following actions

Scan the QR code to install the App and get 2 free unlocks

Unlock quizzes for free by uploading documents