Use the figure below to answer the following question(s) . Figure 10-5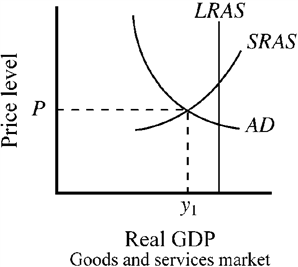 Given the aggregate demand and aggregate supply conditions depicted in Figure 10-5, which of the following is the most likely occurrence?
A) an increase in resource prices that will stimulate aggregate demand and direct the economy to long-run equilibrium
B) a decrease in resource prices that will reduce costs and shift SRAS to the right, directing the economy to long-run equilibrium
C) a continuation of this price level and output in the long run
D) a shift in LRAS to the left as the result of an increase in the expected inflation rate
Correct Answer:
Verified
Q149: Use the figure below to answer the
Q150: Use the figure below to answer the
Q151: Use the figure below to answer the
Q152: Use the figure below to answer the
Q153: Use the figure below to answer the
Q155: Use the figure below to answer the
Q156: Use the figure below to answer the
Q157: Use the figure below to answer the
Q158: Figure 10-13 Q159: Use the figure below to answer the![]()
Unlock this Answer For Free Now!
View this answer and more for free by performing one of the following actions

Scan the QR code to install the App and get 2 free unlocks

Unlock quizzes for free by uploading documents