Figure 15-3 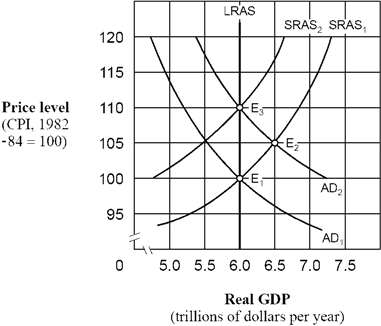 As shown in Figure 15-3, if people behave according to adaptive expectations theory, an increase in the aggregate demand curve from AD1 to AD2 will cause
A) labor to adjust nominal wages sluggishly.
B) the aggregate supply curve to shift from SRAS1 to SRAS2
C) the price level to eventually rise from 100 to 110.
D) All of the above.
Correct Answer:
Verified
Q146: The index of leading indicators is
A) an
Q147: Economic analysis suggests that countercyclical macro-policy will
A)
Q148: Under the adaptive expectations hypothesis, how will
Q149: Why did many economists during the 1960s
Q150: Use the figure below to answer the
Q152: Figure 15-3 Q153: In the twentieth century, fluctuations in real Q154: Which of the following is an implication Q155: Figure 15-3 Q156: Under the rational expectations hypothesis, which of![]()
![]()
Unlock this Answer For Free Now!
View this answer and more for free by performing one of the following actions

Scan the QR code to install the App and get 2 free unlocks

Unlock quizzes for free by uploading documents