Figure 15-3 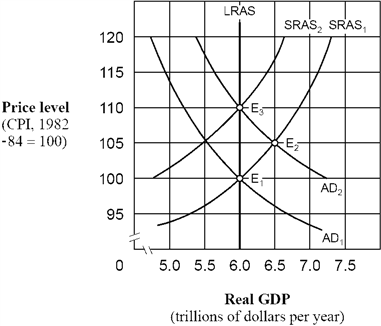 As shown in Figure 15-3, if people behave according to rational expectations theory, an increase in the aggregate demand curve from AD1 to AD2 will cause the price level to move
A) directly from 100 to 105 and then remain at 105.
B) directly from 100 to 110 and then remain at 110.
C) from 100 to 105 initially and then eventually move back to 100.
D) from 100 to 105 initially and then eventually move to 110.
Correct Answer:
Verified
Q152: Figure 15-3 Q153: In the twentieth century, fluctuations in real Q154: Which of the following is an implication Q155: Figure 15-3 Q156: Under the rational expectations hypothesis, which of Q158: The adaptive expectations hypothesis implies that people Q159: If the monetary authorities follow policies that Unlock this Answer For Free Now! View this answer and more for free by performing one of the following actions Scan the QR code to install the App and get 2 free unlocks Unlock quizzes for free by uploading documents![]()
![]()
A)

