Multiple Choice
The figure below illustrates a tariff. On the graph, Q represents quantity and P represents price. Figure 17-11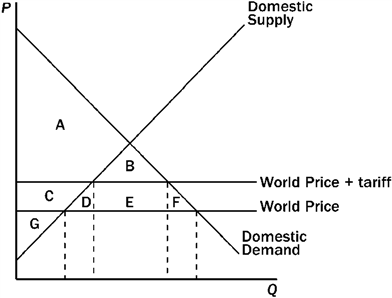 Refer to Figure 17-11. The deadweight loss created by the tariff is represented by the area
A) B.
B) D + F.
C) D + E + F.
D) B + D + E + F.
Correct Answer:
Verified
Related Questions
Q148: The figure below illustrates a tariff. On
Q149: Figure 17-13 Q150: Figure 17-10 Q151: Figure 17-12 Q152: Figure 17-10 Q154: Figure 17-13 Q155: Figure 17-13 Q156: The figure below illustrates a tariff. On Q157: Figure 17-10 Q158: Figure 17-13 Unlock this Answer For Free Now! View this answer and more for free by performing one of the following actions Scan the QR code to install the App and get 2 free unlocks Unlock quizzes for free by uploading documents![]()
![]()
![]()
![]()
![]()
![]()
![]()
![]()

