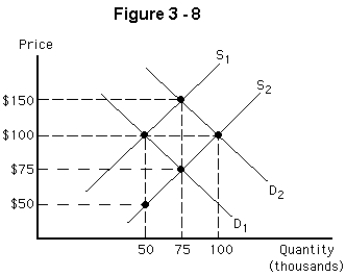
-In Figure 3-8,using the supply and demand curves denoted S₁ and D₂,respectively,the equilibrium price and quantity are
A) $100 and 50,000
B) $100 and 100,000
C) $150 and 50,000
D) $150 and 75,000
E) $150 and 100,000
Correct Answer:
Verified
Q106: If an improvement in production technology causes
Q107: If sellers decide to sell more calculators
Q108: If the resource prices faced by a
Q109: If steel manufacturers expected that the price
Q110: Which of the following would shift the
Q112: An increase in quantity supplied can be
Q113: Studies show that the supply curve for
Q114: In a competitive market,when price is below
Q115: If the price of new automobiles rises
Q116: ![]()
Unlock this Answer For Free Now!
View this answer and more for free by performing one of the following actions

Scan the QR code to install the App and get 2 free unlocks

Unlock quizzes for free by uploading documents