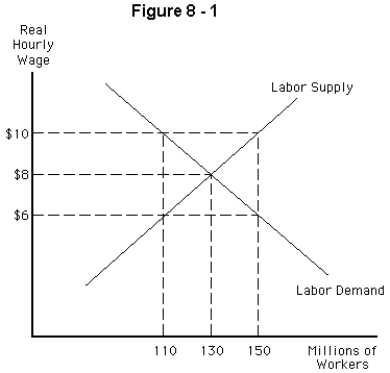
-Refer to Figure 8-1.According to the graph,the equilibrium real hourly wage and quantity of labor employed,respectively,are
A) $10,110 million workers
B) $8,130 million workers
C) $8,150 million workers
D) $6,150 million workers
E) $6,130 million workers
Correct Answer:
Verified
Q34: The supply of labor
A) varies inversely with
Q35: The labor demand curve slopes downward because
A)
Q36: Q37: According to the classical model,there is no Q38: The labor demand curve shows the Q40: The labor demand curve slopes Q41: What is the effect of diminishing returns Q42: Which of the following best describes the Q43: A country's total output,or real GDP,is determined Q44: If the labor supply and demand curves![]()
A) number
A) upward to
Unlock this Answer For Free Now!
View this answer and more for free by performing one of the following actions

Scan the QR code to install the App and get 2 free unlocks

Unlock quizzes for free by uploading documents